
The State of Alcohol Alternatives
The consumer answer before you set your 2027 plans. Know how they actually buy, and what’s on the shelf to meet them. Built on surveys of 2,000+ American consumers and the Dry Atlas Product Database.
50 pages · 36 exhibits · $2,495, backed by our answer guarantee
Built for beverage decision makers
Strategy, insights, and innovation teams at large beverage companies, including global companies planning their U.S. business, who need a consumer baseline and evidence to make the internal case.
Investors and acquirers underwriting a brand or screening the category.
Founders and operators deciding how to position and price, and walking into buyer, distributor, and investor meetings with third-party data.
Retailers, distributors, and hospitality groups building a non-alc set for shelves, bars, restaurants, and hotels.
It covers the U.S. market: surveys of American adults 21+ and NIQ U.S. off-premise sales.
What the October data shows
Three questions the October 2026 Edition answers
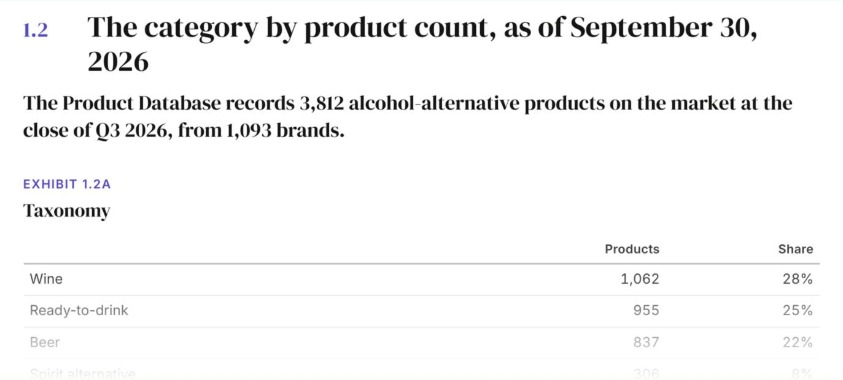
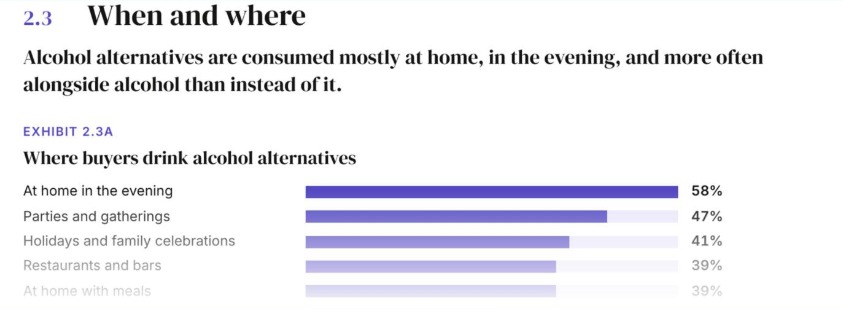
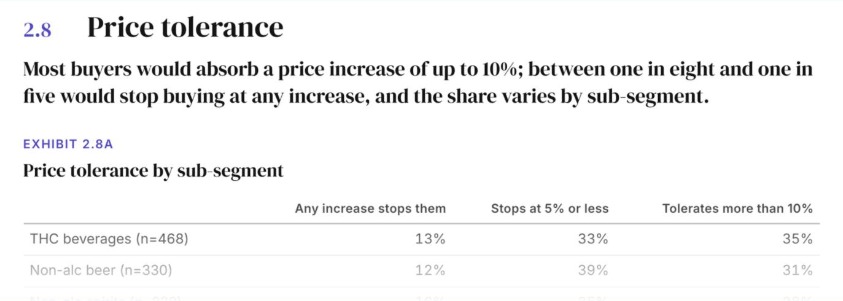
Three of the 36 exhibits in the October 2026 Edition.
Full table of contents and chart list
Executive summary
Section 1: Category. 1.1 The category by dollar sales, 52 weeks ending Sept. 26, 2026 · 1.2 The category by product count, as of Sept. 30, 2026 · 1.3 Inside the sub-segments
Section 2: Consumer. 2.1 Who is in the category · 2.2 Why they are here · 2.3 When and where · 2.4 How engaged · 2.5 How they buy · 2.6 Brands · 2.7 What holds them back · 2.8 Price tolerance · 2.9 Where the category is going · 2.10 What’s changing · 2.11 The season ahead: holiday gatherings and Dry January 2027
Section 3: Outlook. 3.0 What the category data implies · 3.1 Predictions for Q1 and Q2 2027 · 3.2 Recommendations by reader
Methodology · About Dry Atlas
Charts, selected. Dollar sales and growth by segment (1.1) · the category by sub-segment and taxonomy (1.2a, 1.2b) · styles, can and near-zero share, and products per brand (1.3a–1.3c) · past-six-month consumption of alcohol and alternatives (2.1a) · incidence by age (2.1c) · 11 reasons to drink (2.2a) · reasons by mindset and age (2.2b, 2.2c) · occasions (2.3a) · instead, alongside, or anyway (2.3b) · frequency, recency, overlap, and loyalty by sub-segment (2.4a–2.4d) · where buyers shop, discovery reach against influence, and monthly spend (2.5a–2.5c) · unaided brand recall (2.6a) · barriers, taste, and availability by sub-segment (2.7a–2.7e) · price tolerance by sub-segment (2.8a) · expected consumption and functional-ingredient interest (2.9a, 2.9b) · holiday gatherings and Dry January 2027 (2.11a, 2.11b) · the predictions table (3.1) · recommendations by reader (3.2a).
$2,495 per edition
No subscription required. Teams: enterprise licensing by agreement.
PDF in your inbox on purchase, backed by our answer guarantee.
Answer guarantee. If the report doesn’t answer the question you bought it for, book an hour with our team within 60 days of purchase and we’ll answer it from our proprietary data and category expertise.
Need help deciding? Ask before you buy →
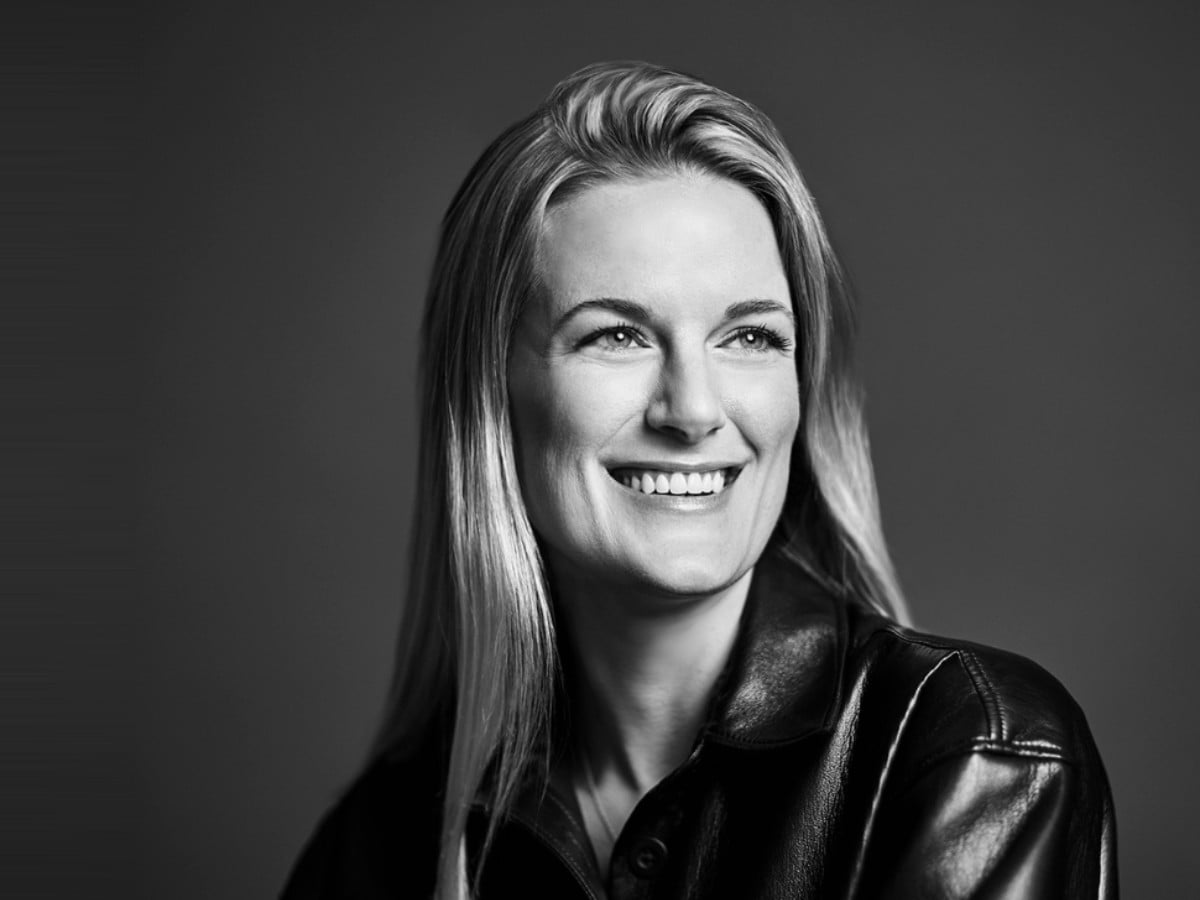

By co-founders Victoria and Douglas Watters, who built Spirited Away, America’s first non-alcoholic bottle shop, and ran it for five years.
Ask before you buy
We reply within one business day.
From the experts who understand the category
Most of what exists on alcohol alternatives is either a trend piece or a survey run by generalists. The State of Alcohol Alternatives comes from a team that has worked in the U.S. alcohol alternatives market since 2020, first selling these products at retail and now tracking them. It combines our national consumer surveys with proprietary data on 4,300+ products, on and off the market.
Before Dry Atlas, its co-founders built Spirited Away, America’s first non-alcoholic bottle shop, and ran it for five years until its acquisition. The shop was covered by The New York Times, The Wall Street Journal, and Vogue. Before that, Victoria did market research and product marketing at J.P. Morgan, then joined Galaxy as its first marketing hire and rose to lead product marketing. She writes the Grow column for Inc.
How it was built
Frequently asked questions
Is it national data or buyer data?
Both, kept separate: a YouGov national sample and a Prodege sample of category buyers, never combined in one finding.
Does it cover my sub-segment?
It covers five sub-segments: non-alc beer (including hop water), wine, spirits, ready-to-drink cocktails, and THC beverages. Eleven of the 29 consumer exhibits are cut by sub-segment, and the product section cuts the database by sub-segment, style, ABV class, format, and brand structure. Mixers and functional drinks are not sub-segments of their own.
What does it replace?
Unscientific customer surveys and what a buyer said at the last show. If you have NIQ or Circana scan data, it sits beside it: the scan tells you what sold, this tells you who bought it and why. It also covers what scan data can miss: brands too new or too small to show up cleanly, and products whose labels don’t identify them as non-alcoholic.
How long does it take to read?
An afternoon. The six findings are on page one; every exhibit is sourced and built to drop into a deck.
What happens after I buy?
The PDF arrives on purchase. If it doesn’t answer the question you bought it for, book an hour with us within 60 days. Editions are sold one at a time.
Can my team use it?
A single edition is licensed to one named person for internal use. At companies with 50 or fewer employees, counted at the group level, it covers the whole company. Larger teams license by agreement: see the enterprise license.
Does it cover markets outside the U.S.?
No. The report covers the U.S. market: surveys of American adults 21+ and NIQ U.S. off-premise sales. It is built for companies selling in the U.S., including companies abroad planning their U.S. business.
Does it include SKU-level sales velocity?
No. For SKU velocity, use a scan data provider such as NIQ, Circana, or SPINS. This report covers who buys, why, where, and what holds them back, which scan data can’t show.
Can’t I get this from free reports or AI tools?
Those summarize what’s already published. This report runs on data nobody else has, because we collected it: two consumer surveys fielded in October 2026 and a hand-maintained record of every product on the market.
Can I use it in a deck for leadership, investors, or a buyer?
Yes. You can quote individual figures and short excerpts with attribution. Full tables, charts, and sections stay under the license.
It’s not in this year’s budget. Should I wait?
Each edition covers its own quarter, and the October 2026 Edition is built for 2027 planning.
Who paid for it?
Only the people who buy it. The research takes no sponsorship of any kind.
Start with the summary
Six headline findings and the full methodology, free, and short enough to forward to leadership.