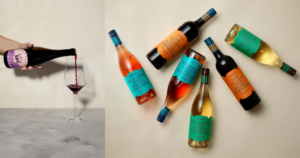
Non-alc wine makes up 28% of the alcohol-alternative products in the category, the largest share of any segment, according to our product database at quarter-end. Among the people who buy alcohol alternatives, it ranks last of the five segments on every engagement measure in our buyer survey. That is one of six headline findings in The State of Alcohol Alternatives, October 2026 Edition, published yesterday.
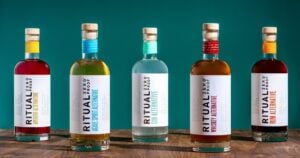
Non-alc spirits runs the other way. It is 18% of products, and it leads non-alc wine and beer on expected consumption, taste, and spend. The shelf and the buyer disagree about where the category’s demand is. A founder choosing a segment, a buyer planning a reset, and an investor sizing a thesis are often reading the shelf.
What wine’s buyers report
The buyer survey, fielded by Prodege Oct. 8 to 16 among 1,003 U.S. adults 21+ who drank an alcohol alternative in the past six months and make or share the household purchase decision, measured the forward-looking picture too. Net expected consumption (the share of a segment’s buyers who expect to drink more of it over the next six months, minus the share who expect to drink less or none) comes out at +8 for wine. Spirits comes out at +21, beer at +19, and ready-to-drink cocktails at +15.
Price sharpens the read. 44% of non-alc wine buyers say they would stop buying at a price increase of 5% or less. A buyer who walks away over a few points of price has substitutes in mind, and in the most crowded segment, they’re on the same shelf. Spirits buyers describe a stronger attachment to the product itself: 82% rate non-alc spirits as good as or better than spirits.
What the gap means
For a founder choosing where to launch, product count measures competition. Wine’s 28% tells a founder how many products a new launch has to displace. Its +8 tells them how wine’s own buyers expect to drink over the next six months.
For a non-alc wine brand already on the shelf, find the 17% who drink weekly and the buyers who would stay through a price increase. The full report cuts price tolerance, spend, and expected consumption by segment, along with the product-level detail behind the 28%, so a brand can see precisely how crowded its own position is.